Description
PROBLEM
Scientists struggle with documenting data from their experiments because they have to use their hands to take notes while they are manipulating special or dangerous substances.
OPPORTUNITY
The lack of efficiency and precision in the documentation process of laboratory experiments.
TARGET AUDIENCE
Biotechnologists, nanotechnologists, biologists, laboratory technicians, and scientists doing research or working in commercial laboratories with BioSafety Levels I & II.
SUMMARY
Noland is a mixed reality documentation software that increases laboratory productivity and makes the process of taking notes and making calculations more efficient by providing the scientists with a Virtual Assistant.
Design Process
Phase 1 – Empathize
DISCOVERY
One year ago, I was in Boston, one of the most important clusters of innovation and knowledge. While talking with biotechnologist I found a problem that inspired me to create my grad project.
I conducted various types of research: Semi-structured interviews, diary study, field study, and online literature. These allowed me to empathize with the users and understand their goals, motivations and pain points.
PERSONAS
I analyzed all the qualitative and quantitative data from the research and started creating personas.
“Personas are archetypical users whose goals and characteristics represent the needs of a larger group of users. Personas help a product team find the answer to one of their most important questions, who are we designing for?” — Nick Babich
In order to create accurate personas, I started analyzing the users’ profiles, found patterns and separated all of them in groups. I created data towers with all the patterns I found. I grouped the ones that were more repetitive and had higher priority for my users. Instead of just creating my personas from their demographics, I created them from their motivations, goals, points of pain and behaviors.
EXPERIENCE MAP
Once I defined my personas, I analyzed their journey and designed an experience map that helped me understand every single moment of the users’ experience.
I divided the users’ experience into three phases and I discovered that the main pain points happened during the second phase, when scientists start working with their samples and documenting data in the laboratory.
Phase 2 – Define
AFFINITY DIAGRAM
I conducted a second round of interviews and found more information about the experience of the users working in laboratories.
I clustered all the data from the interviews and designed an affinity diagram. I summarized the content of each cluster and wrote an “I” statement that helped me rename the groups using a phrase that represented the content of each cluster. I also identified the current tools, activities, and behaviors that the users had in common.
ROOT CAUSE ANALYSIS (RCA)
I used a root cause analysis to define a solution for the problem. First, I found the symptoms of each problem that I previously identified in the affinity diagram and found the root cause of each of them.
I explored feasible solutions and their possible positive effects. I matched each point of the Affinity Diagram with the motivations and problems of the users to ensure that the proposed solution adapted well with the needs, motivations and current behaviors of the users.
PROBLEM
Through my research, I found that scientists struggle with documenting data. Why? Because they are constantly using their hands to manipulate substances while they are taking notes or making calculations.
The lack of efficiency in the documentation process at laboratories makes the scientists feel frustration and stress. It also increases the levels of contamination and uncertainty, since they have to take off their gloves to take notes. Sometimes they prefer to memorize the results of their research and write it down later on their lab notebook.
PROPOSED SOLUTION
A mixed reality documentation software for scientists working in laboratories with Biosafety levels I and II to record and document data from their experiments with more efficiency, safeness and reducing the ambiguity of the results.
Current experience
Proposed solution
MENTAL MODEL
Since I was pursuing a UCD approach, I decided to execute a Mental Model to define the core features of my proposed solution. I took all the data points from my affinity diagram and identified the features that were more useful for the users.
CORE FEATURES
Phase 3 – Ideate
WHY MR?
Currently, scientists use notebooks, computers or mobile gadgets to record their data. Noland works with HoloLens, which is a pair of mixed reality smart glasses that projects holograms and allows users to engage and interact with them.
Hololens also supports Cortana, a virtual assistant that can provide answers and complete tasks using voice commands. Cortana can also be connected to a bot powered by Microsoft Azure. Giving the opportunity to integrate machine learning to understand complex data and calculations.
USER FLOW & WIREFRAMES
I started developing quick paper prototypes in the ideation phase. First, I drew some sketches of the interface and later defined the user flow of the solution as well as the wireframes of the core features.
MOTION GESTURE ANALYSIS
I analyzed the behavior of the users in a laboratory environment and I conducted an acting user testing. I analyzed the motion gestures of the users and found some patterns that helped me understand the users’ behavior in a 3D environment.
CARD SORTING
After I defined the most common and convenient motion gestures for the users, I conducted card sorting sessions with scientists to understand their language and to define the information architecture and the labeling of the interface.
VISUAL DESIGN
I designed the user interface using 2D and 3D assets to have an accessible and immersive UI. I modeled 3D icons in Cinema4D and 3D placeholders in Autodesk Maya. Finally, I created all the textures, materials, and particles in Unity.
Phase 4 – Prototype
CLICKABLE PROTOTYPE
I developed a clickable prototype to test the information architecture, content, labeling and hierarchy of the core features. I created different scenes to conduct an AB testing with the all the stakeholders. This time I also interviewed UX designers and engineers that work with HoloLens.
Clickable prototype set up.
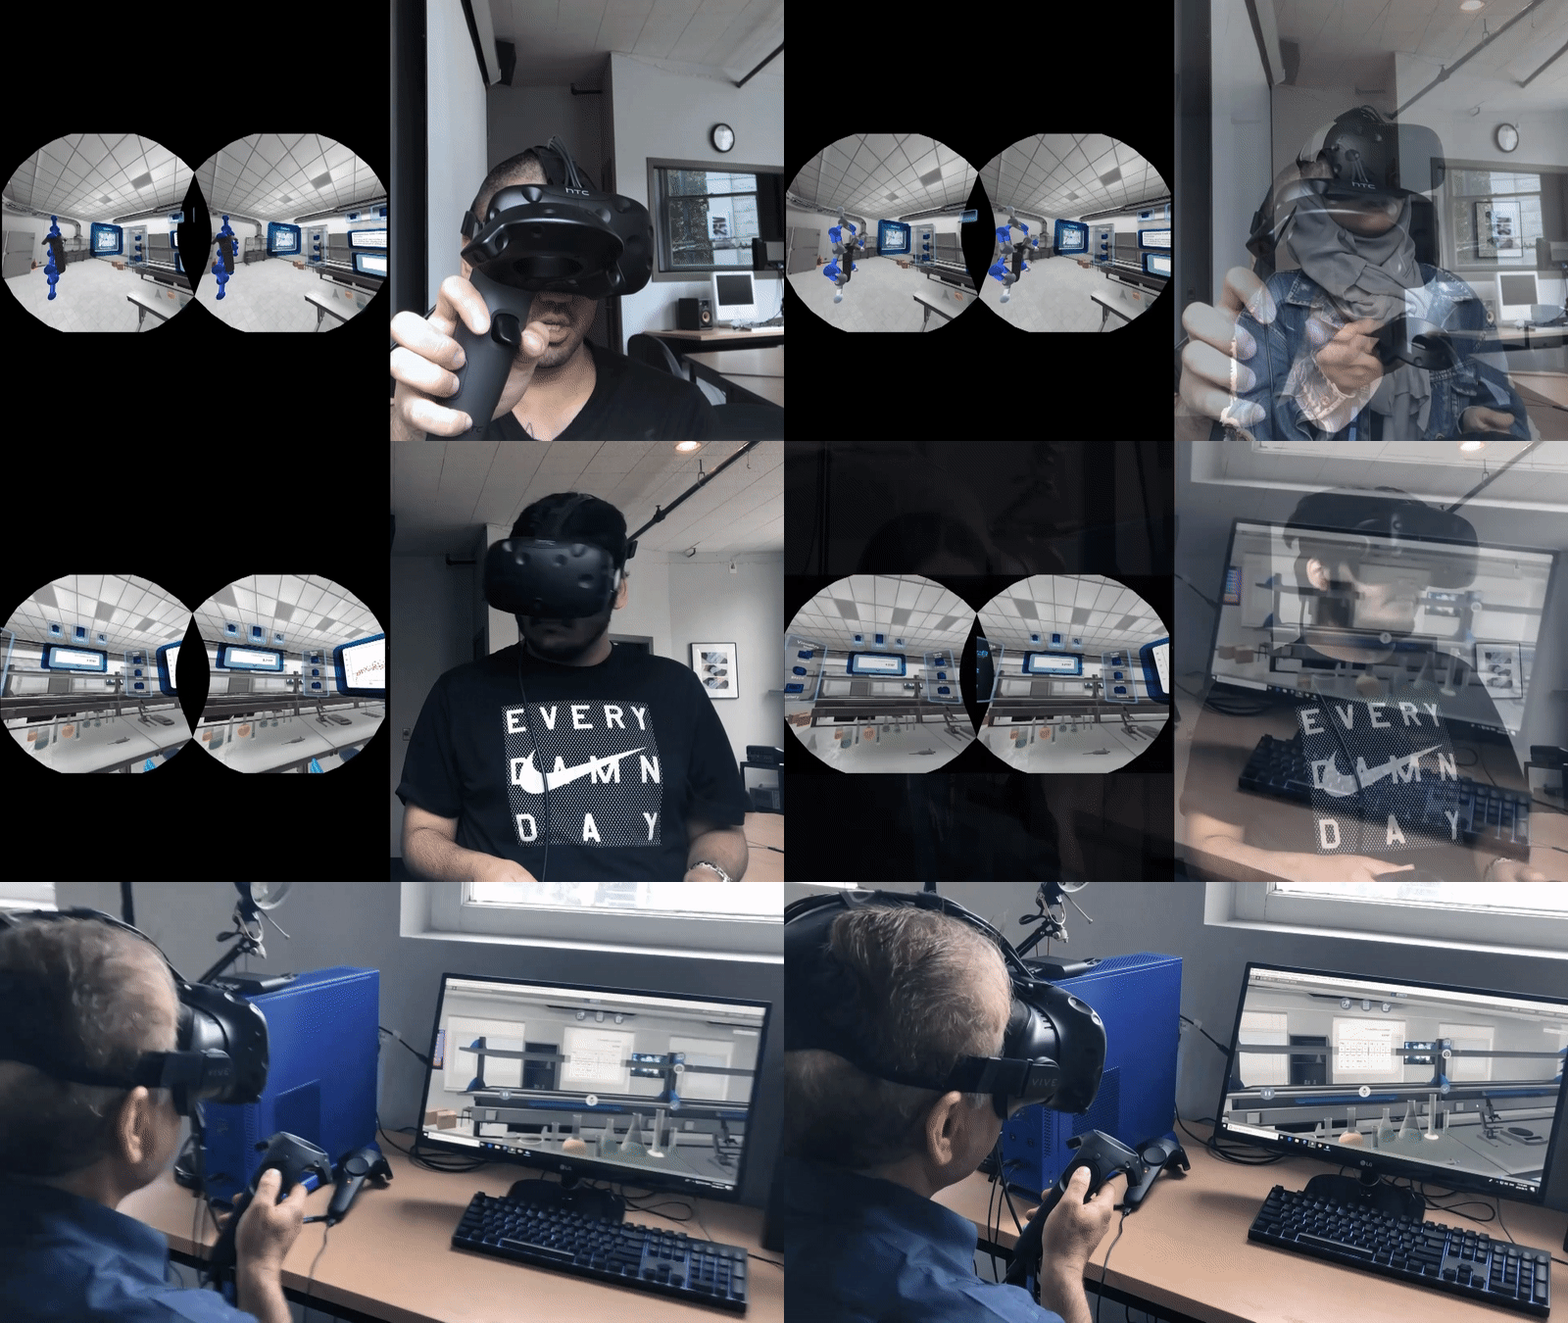
Testing clickable prototype.
MVP
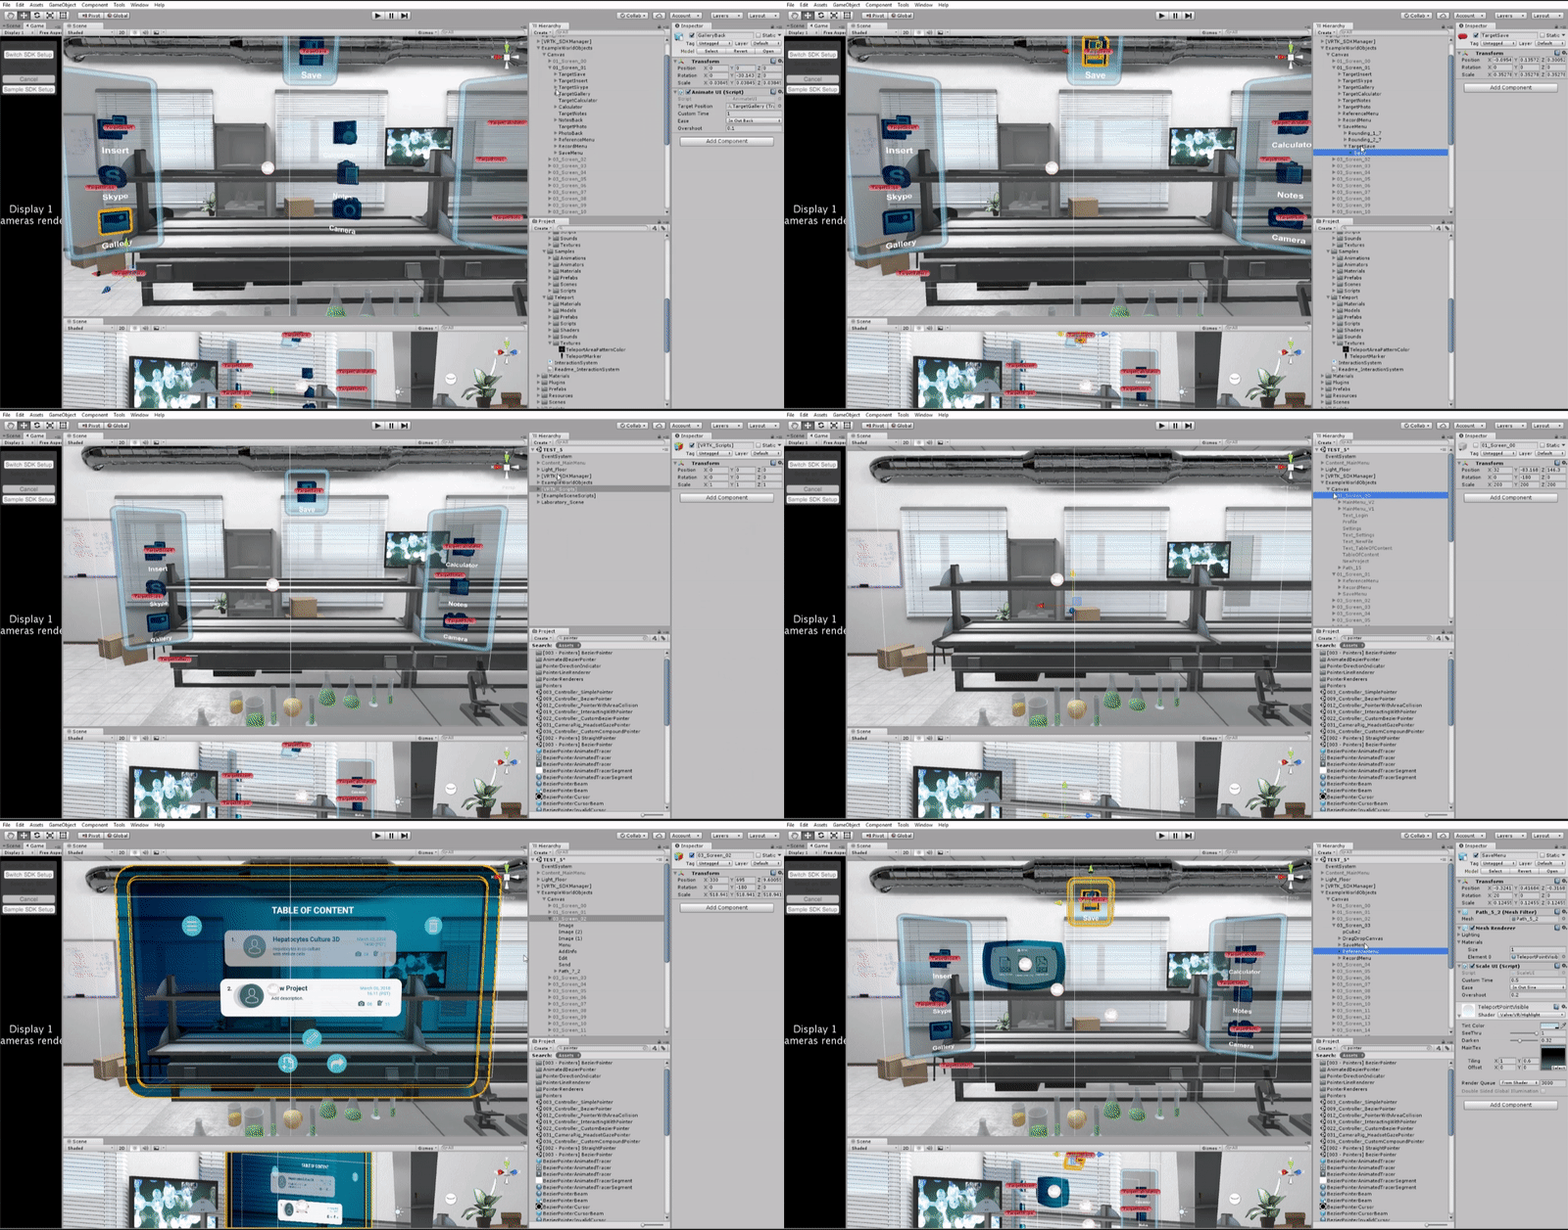
For my MVP It was important to find an effective, quick and low-cost tool to test and iterate my solution. Since I didn’t have access to HoloLens, I decided to develop a Virtual Reality prototype in Unity.
In order to simulate an MR environment, I used a 3D set up of a laboratory and included a 3D model of hands, which worked with the same gestures as HoloLens.
For the functionality of my prototype, I used a VR toolkit and wrote some scripts in C#.
Phase 5 – Validate
USABILITY TESTING
I tested every iteration I made and even though I was incorporating different types of technologies in every prototype, the friction reduced. The users said that the integration of voice commands and a virtual assistant were great features to increase the laboratory productivity and to reduce the contamination possibilities.
“Thank you for this amazing opportunity to collaborate and to give our feedback on this impressive Lab Documentation tool. We hope to see your brilliant design soon in all our labs”. — UBC-BCIT Biotech Club
CHALLENGES
Two of my biggest challenges in this project were the unfamiliarity with the biotech industry and the complexity of the interaction with 3D objects in a virtual environment. Even though I was following the double diamond methodology to solve this problem. I made a change and kept empathizing with my users in every phase. I kept meeting different type of scientists, from different countries, ages, concentrations, and education degrees. This allowed me to have a better understanding of scientific terms, tools, user’s motivations and motion gestures.
SUCCESS METRICS
I measured the success of this solution taking into account the following factors:
Time: The time that scientists took to record data were reduced with Noland. Because now, by just using their voice to take notes, scientists avoid the tedious process of stopping their experiment, taking off their gloves, taking notes, washing their hands and putting the gloves on again.
Precision: Noland empowers scientists and increases the accuracy of their reports by providing them with a virtual assistant that helps them record data, calculate and compare numeric data, and take pictures and videos, all at the same time.
Safety: The levels of contamination were reduced with Noland since users don’t have to use their hands to take notes and expose their skin to the substances they use during the experiments.
Stress: Noland reduces the levels of stress by letting the users multitask while executing experiments.
FINAL VR PROTOTYPE FLOW


